Business Intelligence Project

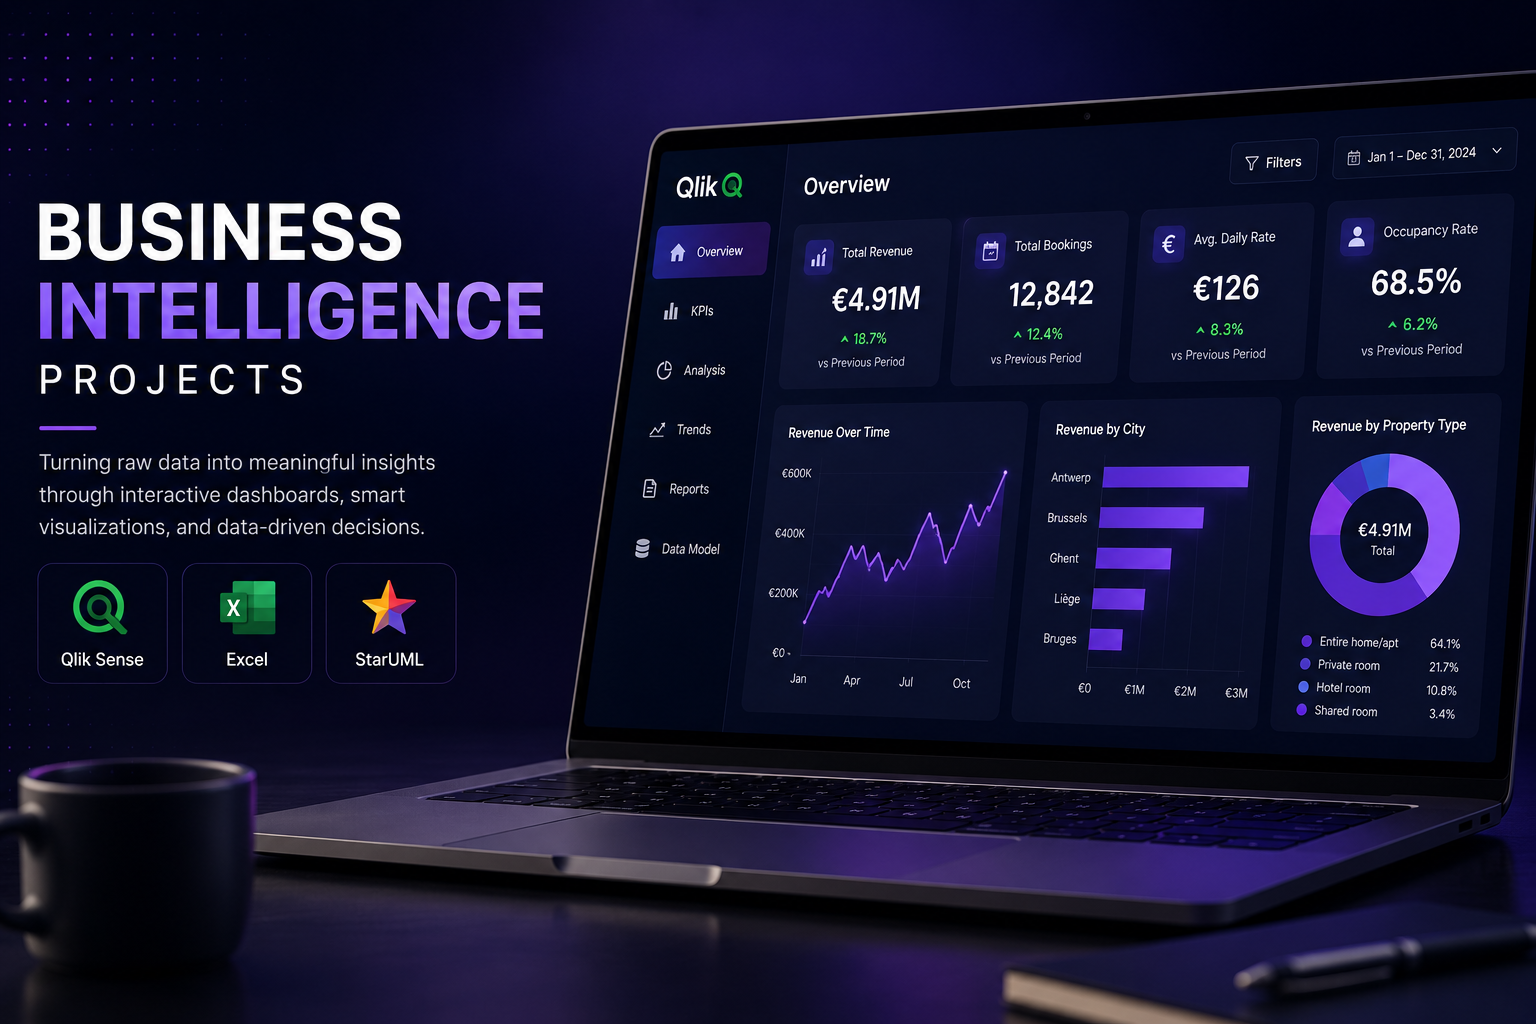
During my Business Intelligence and Data Visualization courses at Thomas More University of Applied Sciences, I designed and developed interactive Business Intelligence dashboards using Qlik Sense.

The projects focused on transforming raw business data into meaningful visual insights through data preparation, data modeling, KPI design, and interactive dashboard development. Rather than simply creating charts, the dashboards were designed to answer real business questions and support data-driven decision-making.

This case study showcases two Business Intelligence projects:

• Airbnb Market Analysis Dashboard
• DAF Manufacturing Business Intelligence Dashboard
View Project Resources

Tools

Qlik Sense, Microsoft Excel, StarUML

Subscription Management Platform

The Goal:

The objective of these projects was to transform raw datasets into interactive Business Intelligence dashboards that help users understand business performance and make informed decisions.

The dashboards were developed by preparing the data, designing the data model, selecting meaningful KPIs, and presenting insights through clear and interactive visualizations. Each project focused on solving real business problems for different audiences using Qlik Sense.

Platform Dashboard
1

The Challenge:

One of the main challenges was preparing the datasets before visualization. This required organizing the imported data, designing relationships between tables, and creating a reliable data model for analysis.

Another challenge was identifying the most relevant KPIs and presenting them in a way that allows users to quickly understand trends, compare performance, and make informed decisions through interactive dashboards.

Platform Features
2

Final Outcome:

The final result consists of two complete Business Intelligence dashboards developed in Qlik Sense. The projects demonstrate my ability to prepare data, design data models, create KPI dashboards, and communicate business insights through interactive visualizations.

These projects strengthened my practical experience with Business Intelligence, dashboard development, data visualization, and analytical thinking while working with real-world business datasets.

Key Skills Demonstrated

  • Business Intelligence Dashboard Development
  • Interactive KPI Reporting
  • Data Modeling in Qlik Sense
  • Business Data Visualization
  • Analytical Problem Solving
Platform Features
3

Project Resources:

Explore both Business Intelligence projects through walkthrough videos and downloadable Qlik Sense applications. These resources demonstrate the dashboard design process, business storytelling, and the final Business Intelligence solutions developed during my coursework.

Airbnb Dashboard Walkthrough

A walkthrough explaining the dashboard, KPIs, visualizations, and business insights for the Airbnb Business Intelligence project.

Watch Video

Airbnb Dashboard

Download the original Qlik Sense application used to build the Airbnb Business Intelligence dashboard.

Download QVF

DAF Dashboard Walkthrough

An overview of the DAF Manufacturing dashboard, data model, KPIs, and the Business Intelligence solution developed in Qlik Sense.

Watch Video

DAF Dashboard

Download the original Qlik Sense application developed for the DAF Manufacturing Business Intelligence project.

Download QVF
5